Operation Analytics and Investigating Metric Spike
Operation Analytics and Investigating Metric Spike
DURATION
6 Weeks
DURATION
6 Weeks
CLIENT
Detecting the Unexpected: Operational Metrics and Anomaly Investigation
CLIENT
Detecting the Unexpected: Operational Metrics and Anomaly Investigation
Advanced SQL Querying & Optimization
Advanced SQL Querying & Optimization
Operational KPI Monitoring Anomaly
Operational KPI Monitoring Anomaly
Detection & Root Cause Analysis
Detection & Root Cause Analysis
EDA
EDA
PROJECT OVERVIEW
PROJECT OVERVIEW
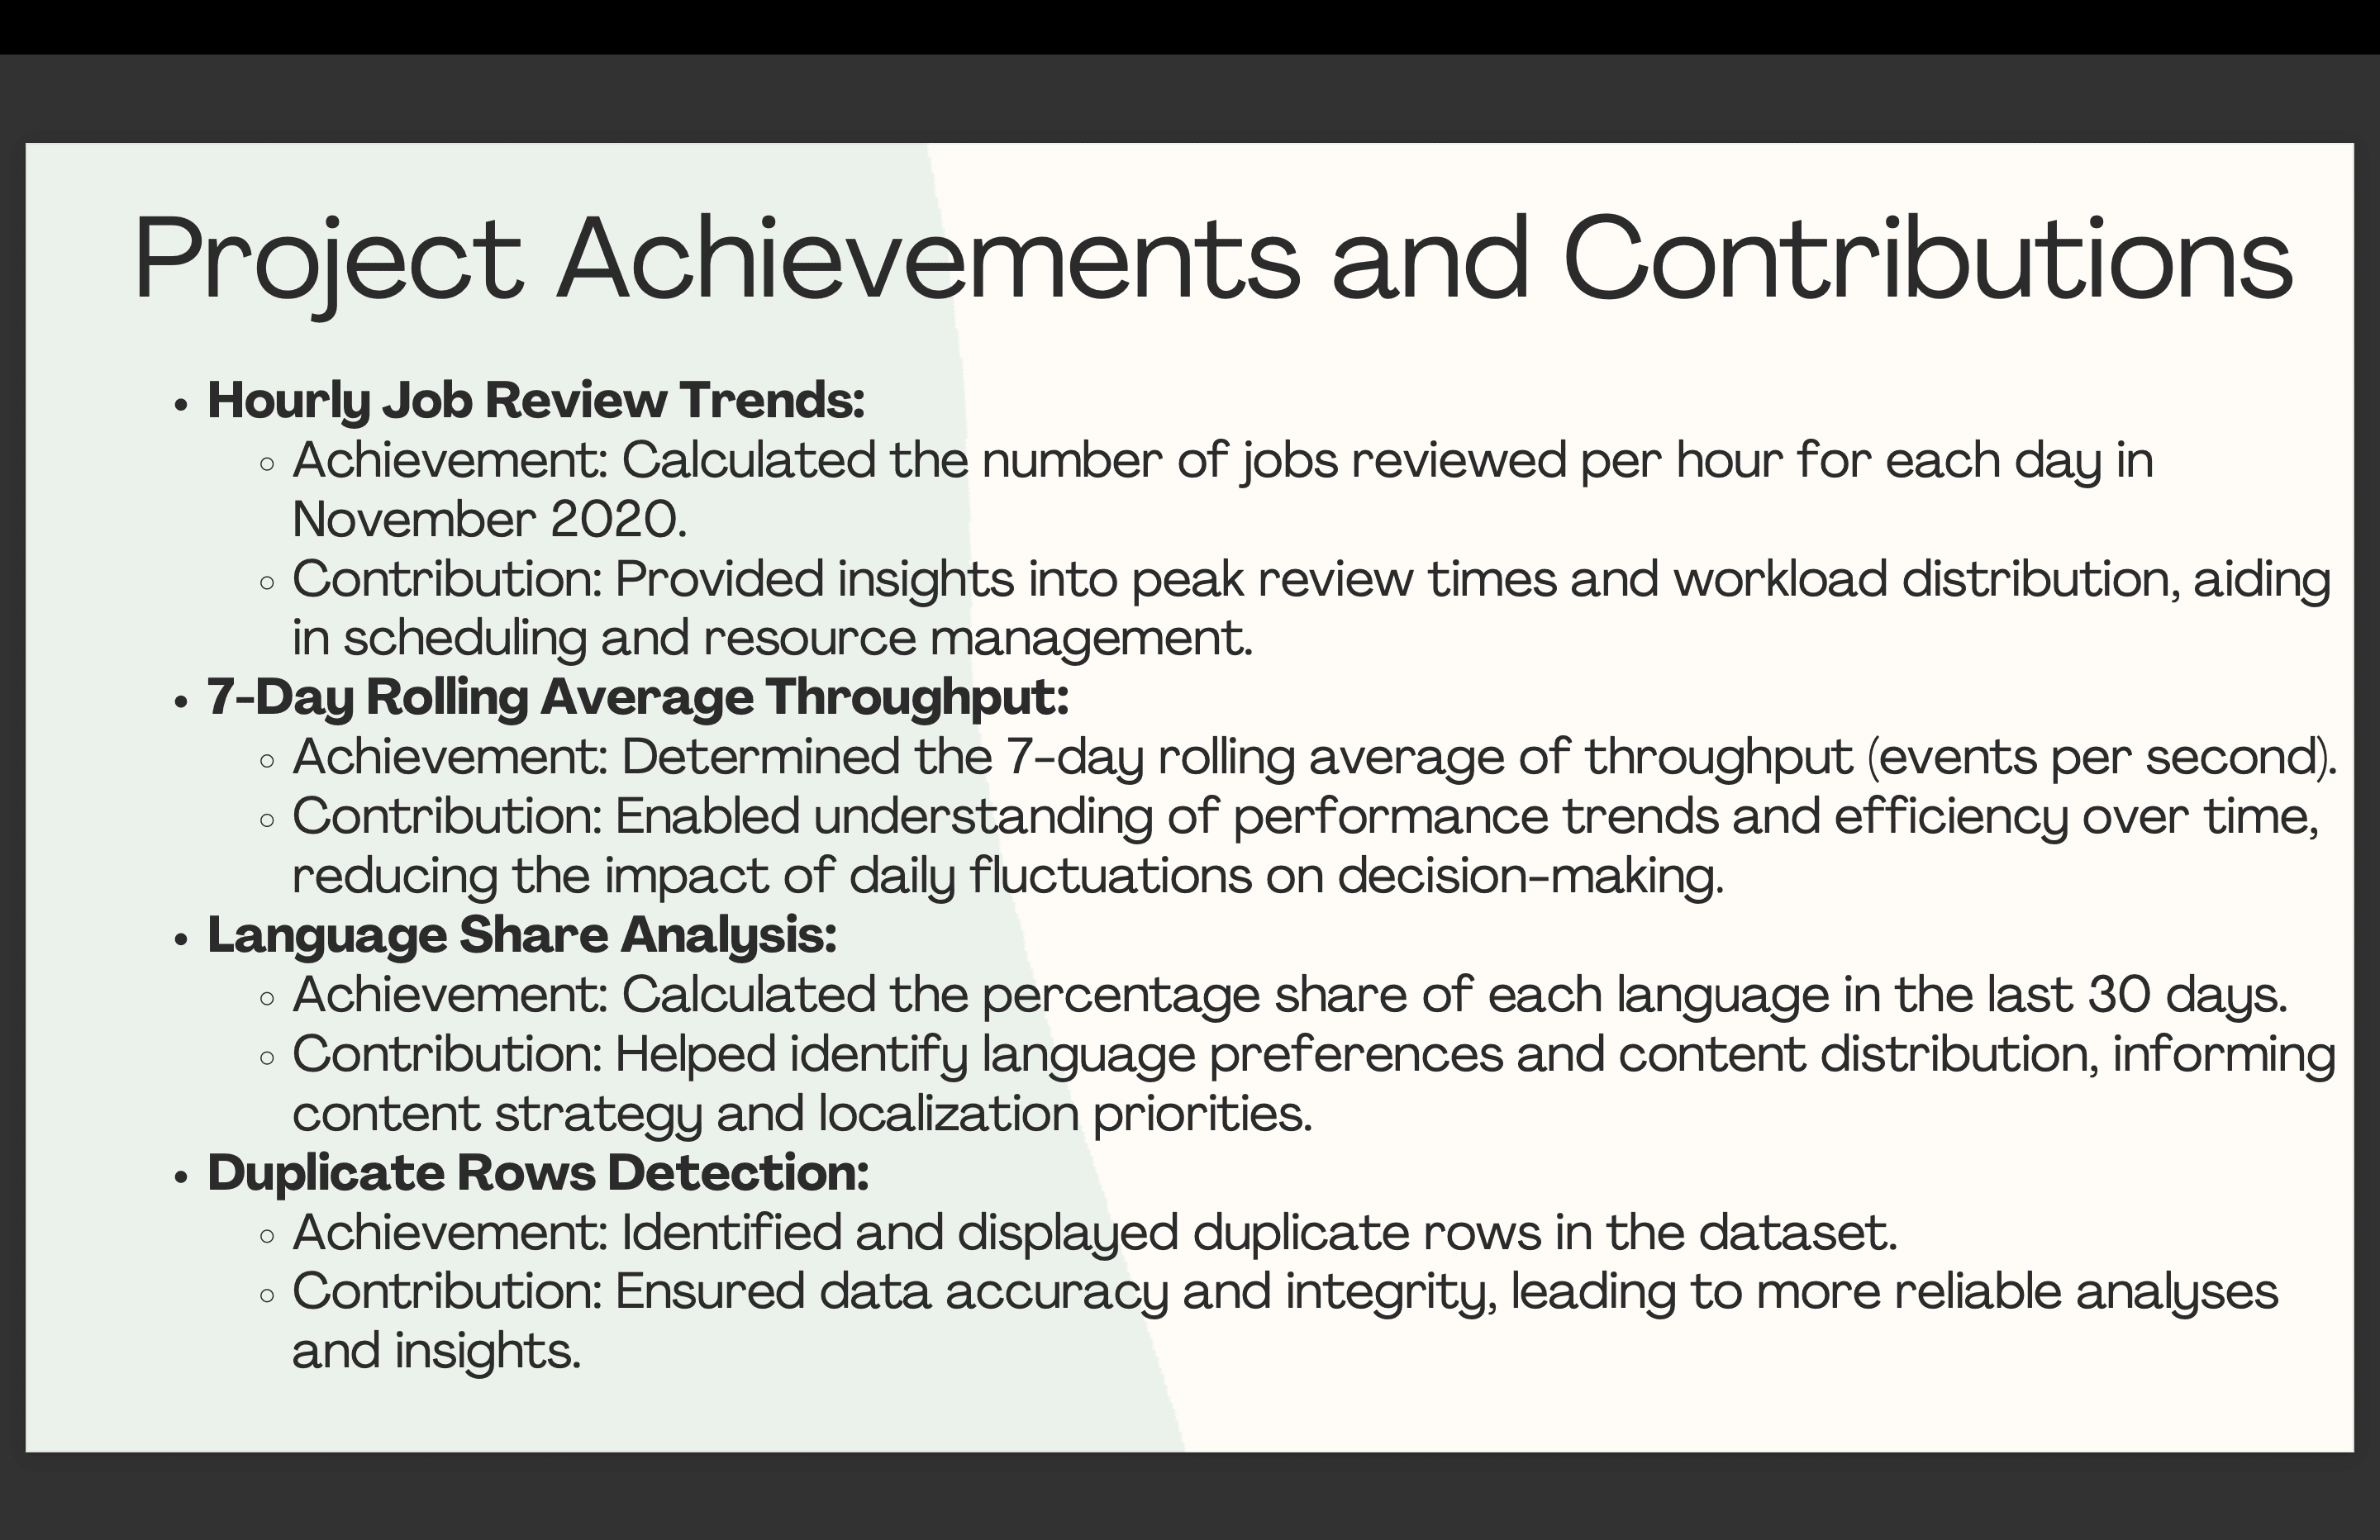
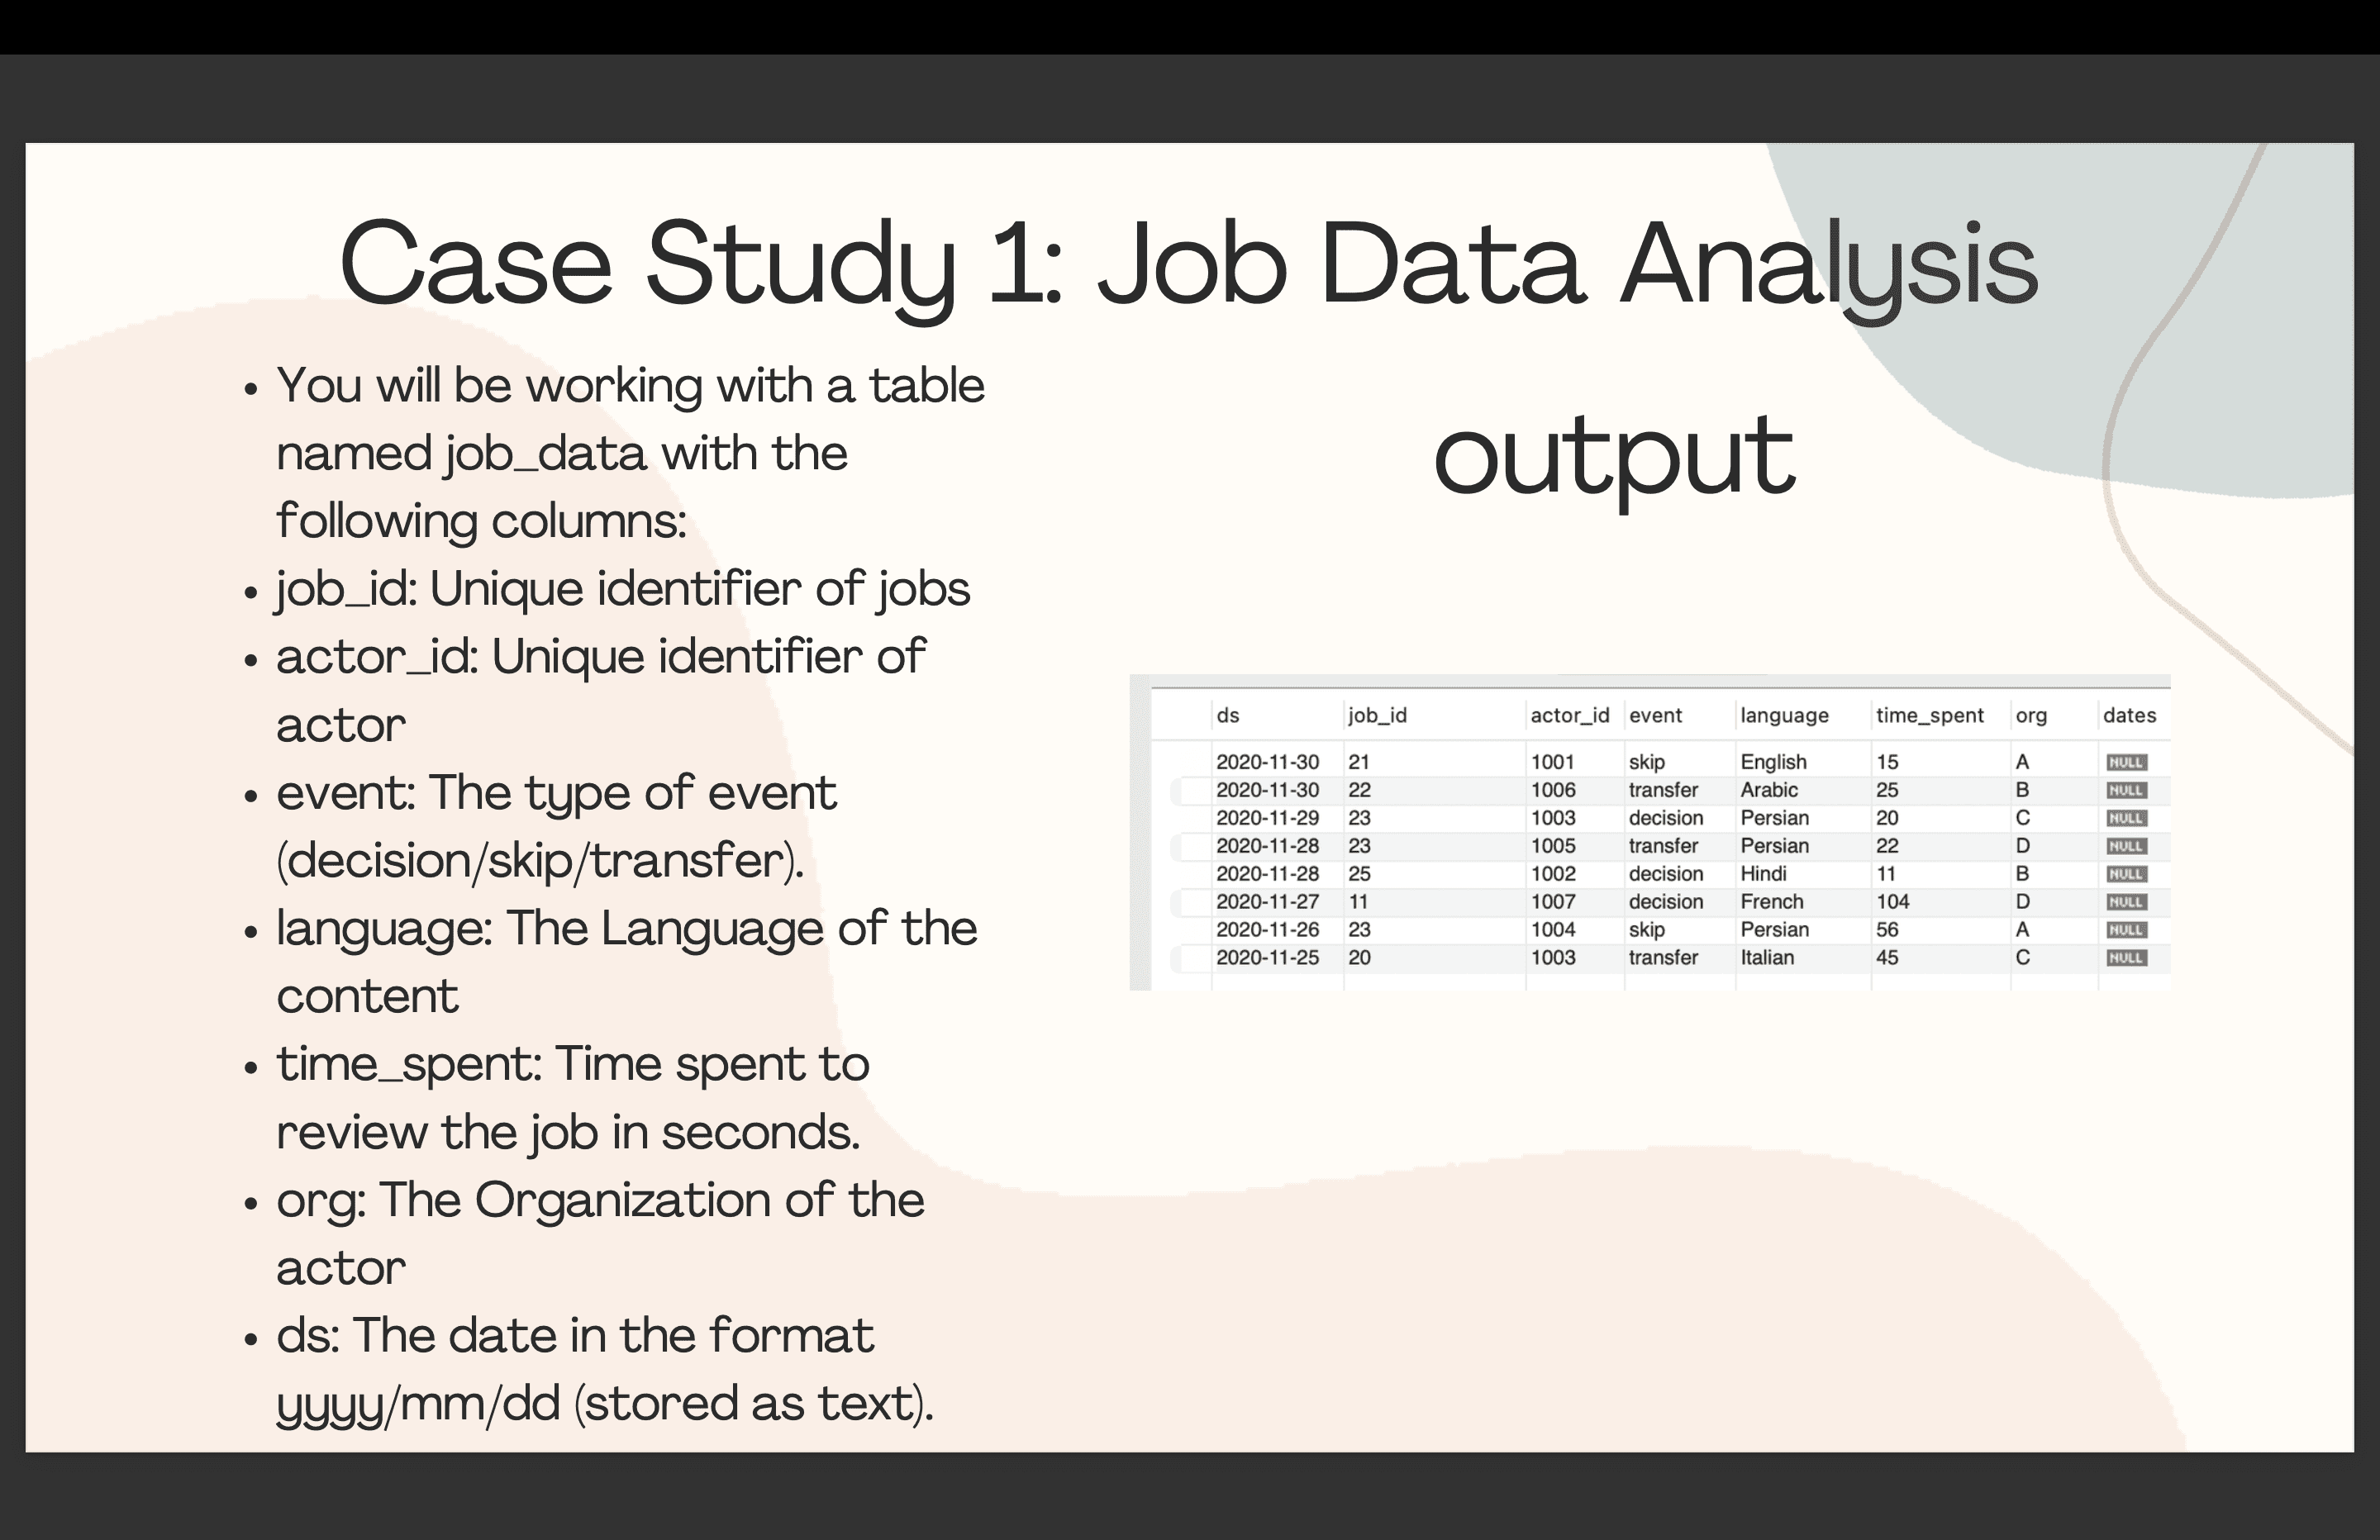
This project focused on uncovering actionable insights from operational and user interaction data to optimize decision-making. Through SQL case studies, I helped simulate real-world analytical problem-solving for internal teams across departments.
This project focused on uncovering actionable insights from operational and user interaction data to optimize decision-making. Through SQL case studies, I helped simulate real-world analytical problem-solving for internal teams across departments.
The Challenge
The Challenge
Balancing multiple KPIs across dynamic datasets while isolating variables responsible for metric fluctuations.
Balancing multiple KPIs across dynamic datasets while isolating variables responsible for metric fluctuations.
WHAT WE DID
WHAT WE DID
Executed deep-dive analysis using SQL on large-scale datasets to uncover patterns in job throughput, language distribution, and user engagement. Identified root causes of metric spikes through systematic investigation across events, user behavior, and email logs.
Executed deep-dive analysis using SQL on large-scale datasets to uncover patterns in job throughput, language distribution, and user engagement. Identified root causes of metric spikes through systematic investigation across events, user behavior, and email logs.

What I Learned / Gained
Improved ability to diagnose and explain metric anomalies across departments.
Enhanced rolling average and cohort analysis using SQL window functions.
Tools & Technologies UsedSQL (Advanced Queries) | PostgreSQL/MySQL | Excel | Data Cleaning | Analytical Thinking
What I Learned / Gained
Improved ability to diagnose and explain metric anomalies across departments.
Enhanced rolling average and cohort analysis using SQL window functions.
Tools & Technologies UsedSQL (Advanced Queries) | PostgreSQL/MySQL | Excel | Data Cleaning | Analytical Thinking
Tannu Antil
Tannu Antil